

- /
When Is the Best Time to Sell a House in Brighton, Michigan?
If you are thinking about selling a house in Brighton, one of the first questions you will probably ask is simple.
When is the best time to put my house on the market?
The usual answer is spring. I wanted to know whether Brighton's own sales history supports that, so I analyzed 1,362 residential sales excluding manufactured homes across the City of Brighton and Brighton Township, covering five complete calendar years. I then re-ran the same analysis on just the most recent three years to see whether the result held up or was shaped by a couple of unusual years. This local pattern sits inside broader Metro Detroit housing market conditions, which is worth reading alongside this piece if you want the regional backdrop.
Across Brighton city and Brighton Township sales from 2021 through 2025, houses listed in March historically produced the strongest combined results across the measures reviewed. That finding held up when I checked it against 2023 through 2025 alone. It is a historical pattern, not a guarantee for any individual house.
How I Analyzed the Brighton Sales Data
This analysis covers residential sales excluding manufactured homes. The starting export contained 1,542 sold listings for Brighton and Brighton Township. Of those, I removed 162 because they fell outside a complete calendar year: 160 from 2026, which was still in progress at the time of this export, and 2 from a partial tail of 2020. That left 1,380 listings from the five complete calendar years of 2021 through 2025. I then excluded 18 manufactured home sales from that group, leaving 1,362 analyzed sales, which I used for the main table, the City and Township breakdown, and the price-tier findings below. I excluded manufactured homes because they represent a distinct property category and price range that would otherwise be combined with the rest of the residential sample.
For geography, I classified each sale using the "Cit-Town-Village" field in the Realcomp export, which records whether a property sits within the City of Brighton or Brighton Township as a legal municipality. I did not use the mailing city field, ZIP code, school district, or the word "Brighton" in the postal address, since those do not reliably match legal municipal boundaries. Five of the 1,362 analyzed sales had no value in that field. Those five stay inside every Brighton-wide figure in this article, including the 1,362 total and the main month-by-month table. They are excluded only from the City-versus-Township comparison, which is why that comparison's two group totals, 989 Township sales and 368 City sales, add up to 1,357 rather than 1,362.
I focused on three measures: the median days from listing to pending, the percentage of houses that sold above their original asking price, and the average sale price as a percentage of the original list price. Together, these say more about buyer competition than comparing median sale prices, which shift based on which houses happened to sell in a given month.
Median Days to Pending by Month Listed
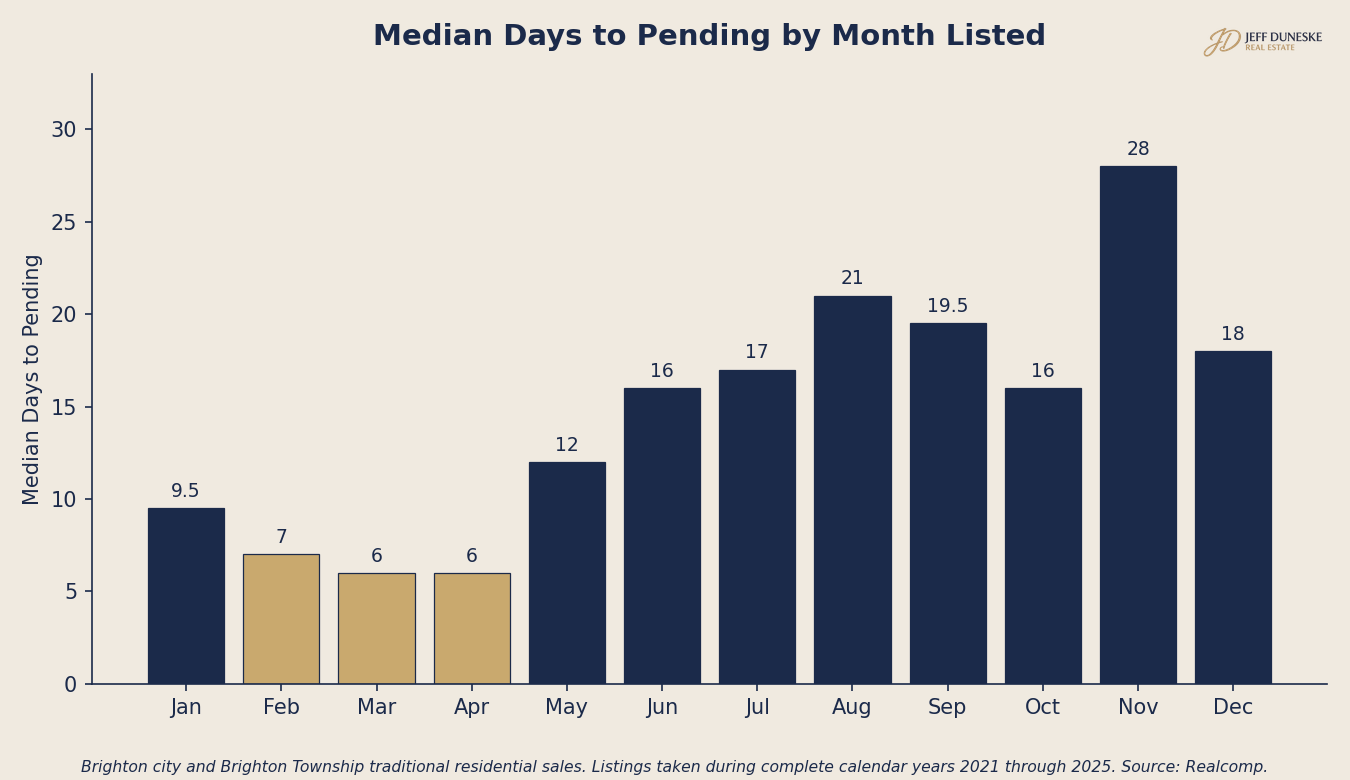
Brighton city and Brighton Township residential sales excluding manufactured homes. Listings taken during complete calendar years 2021 through 2025. Source: Realcomp.
Houses Selling Above Original List Price by Month
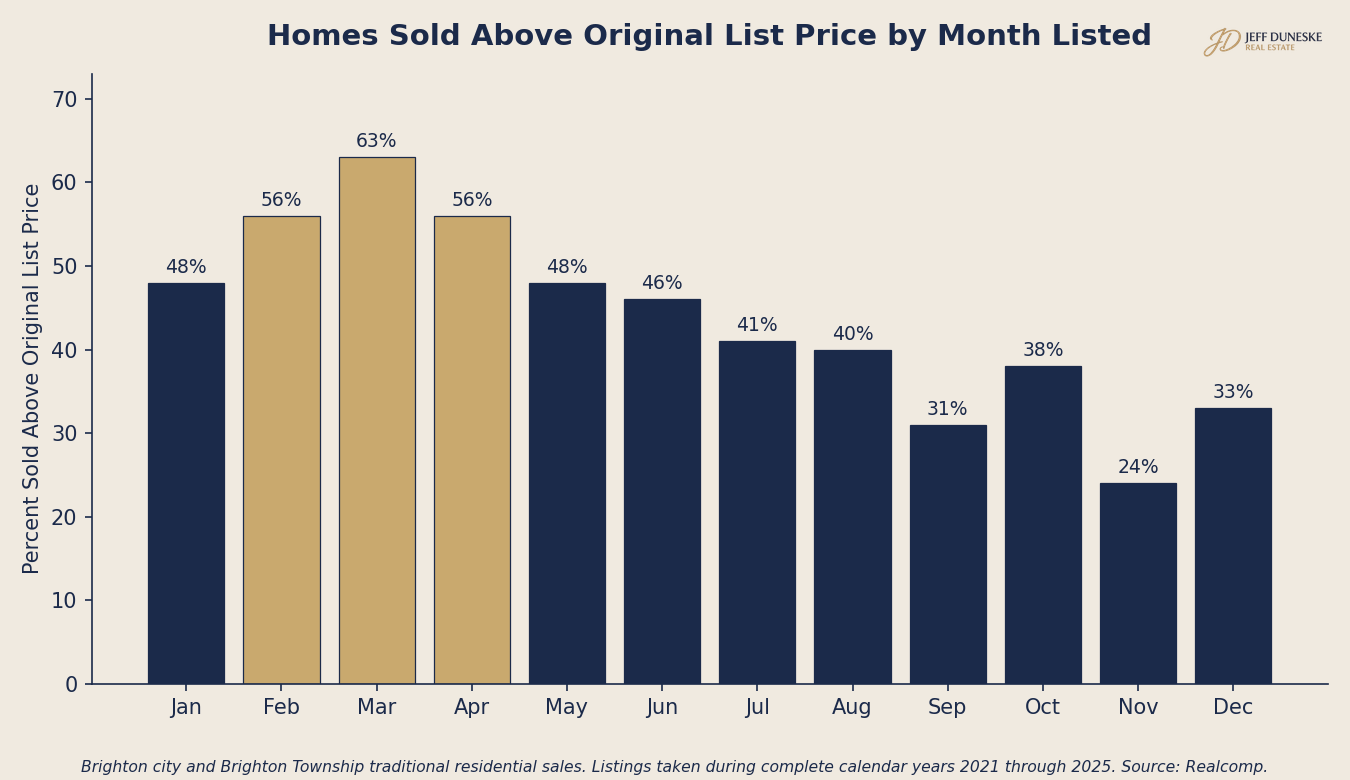
Brighton city and Brighton Township residential sales excluding manufactured homes. Listings taken during complete calendar years 2021 through 2025. Source: Realcomp.
Brighton House Selling Trends by Month, 2021 Through 2025
| Month Listed | Sales (n) | Median Days to Pending | Sold Above Original List Price |
|---|---|---|---|
| January | 54 | 9.5 | 48% |
| February | 63 | 7 | 56% |
| March | 106 | 6 | 63% |
| April | 134 | 6 | 56% |
| May | 149 | 12 | 48% |
| June | 165 | 16 | 46% |
| July | 160 | 17 | 41% |
| August | 151 | 21 | 40% |
| September | 140 | 19.5 | 31% |
| October | 112 | 16 | 38% |
| November | 80 | 28 | 24% |
| December | 48 | 18 | 33% |
Figures reflect residential sales excluding manufactured homes in the City of Brighton and Brighton Township for the five complete calendar years of 2021 through 2025. All twelve months meet this article's reporting threshold of 30 or more sales.
What the Five-Year Data Shows, and What Changed When I Checked the Last Three Years Alone
Across the full five-year period, March produced the strongest combined result: a median of six days to pending, 63 percent of houses selling above their original asking price, and an average sale price of about 103.3 percent of the original list price. February and April were close behind, with April tied for the fastest median at six days.
I then re-ran the same analysis using only the three most recent complete calendar years, 2023 through 2025, to see whether that result was shaped by 2021 or 2022, which included unusually low mortgage rates and unusually tight national inventory. That window contained 820 listings before the manufactured-home filter and 809 after it, applying the same exclusion method described above.
March remained the strongest month by percentage sold above list price (61 percent, based on 62 sales) and by average sale price as a percentage of original list (about 102.2 percent) in the 2023 through 2025 data. On those two measures, the finding held up.
One thing did shift. In the recent three years, March's median time to pending lengthened to 9.5 days, and April became the fastest month at a median of six days, based on 94 sales. February also moved to second on speed, at a median of 8.5 days. March remained the strongest month overall when all three measures are combined, but it no longer stands alone. February, March, and April now form a closely grouped top tier, with April specifically pulling ahead on speed in the more recent window.
The practical read for a Brighton homeowner: late winter through early spring, February through April, has been the historically strongest stretch across both the five-year and three-year views. Within that window, March has the edge on price competition, and April has recently had the speed edge. I would not build a plan around a single "best" month. I would build it around that broader window, then time your specific listing to your house's readiness and the competition you are actually facing.
What Happens After the Spring Window?
The change after April is larger than the differences within the February through April window. May moves to a median of 12 days. June through August run between 16 and 21 days, and the share of houses selling above list price falls from 46 percent in June to 40 percent in August.
November was the weakest month in the full dataset, with a median of 28 days to pending and 24 percent of houses selling above their original asking price. That does not mean November is a bad time to sell. It means pricing, presentation, and condition carry more weight than they do in March.
Is Fall a Bad Time to Sell a House in Brighton?
Historical results were weaker in fall than during the February-through-April window, but that doesn't mean every Brighton homeowner should avoid an autumn sale. Current competing inventory, property condition, pricing, and the seller's timing still matter more than the historical monthly average for any individual house.
The City of Brighton and Brighton Township Do Not Behave the Same Way
Brighton Township historically peaked in March, based on the highest percentage of houses selling above original list price among months with an adequate sample. Township March sales reached a median of six days to pending with 64 percent selling above list, based on 85 sales, a sample large enough for this analysis. Township volume was strong enough that every month in the data meets this article's reporting threshold of 30 or more sales.
Historically, the City of Brighton peaked in April based on the percentage of houses selling above original list price. City April sales reached a median of five days to pending, with 81 percent selling above original list price across 37 sales. February also showed 68 percent above list, but that result is based on only 19 sales and should be treated as directional.
The takeaway is not that one area is a better market than the other. It is that a homeowner in Brighton Township and a homeowner in the City of Brighton are, in effect, watching two related but distinct micro-markets, and the strongest month is not the same for both. For a closer look at how these two markets compare on today's inventory and pricing, see the Brighton Real Estate Market Update: City vs. Township.
Does Price Range Change the Best Time to Sell in Brighton?
Below $400,000, the seasonal pattern was more visible, although some individual monthly samples were directional rather than conclusive. Houses originally listed under $400,000 sold above list more often than the Brighton-wide average in every month from February through June, with samples ranging from 23 to 71 sales per month.
In the $400,000 to $599,000 range, March was the strongest month (54 percent above list, 41 sales, usable), with a more modest version of the same late-winter-through-spring pattern.
Above $600,000, I am not making month-specific claims. Most months in the $600,000 to $899,000 range fall below the usable threshold, several fall below 15 sales entirely, and the $900,000-plus tier has no month in the entire five-year period with 15 or more sales; the busiest month, June, had only 10. At that price point, the appropriate plan comes from a property-specific comparison against current competing listings, not from a monthly seasonal average.
So When Should You List Your Brighton House?
Across Brighton city and Brighton Township sales from 2021 through 2025, houses listed in March historically produced the strongest combined results across the measures reviewed. That result held up when checked against the most recent three years alone. February and April form a closely related strong window around it.
That is a historical pattern. It doesn't guarantee results for your house, and it isn't a reason to rush a listing before it is ready. Month listed is one factor. Municipality, property type, price range, condition, current competition, and pricing strategy still determine the right plan for a specific house. A house that needs several weeks of preparation will usually do better entering the market ready in April than entering the market unfinished in February.
Frequently Asked Questions About the Best Time to Sell in Brighton
When is the best time to sell a house in Brighton, Michigan?
Based on local sales data from 2021 through 2025, and confirmed again using 2023 through 2025 alone, February through April has historically produced the fastest sales and strongest price competition for Brighton and Brighton Township houses, with March showing the strongest combined result. This is a historical pattern, not a prediction for any individual sale.
Does this finding hold up in more recent years, or was it driven by 2021 and 2022?
It holds up on two of the three measures. March remained the strongest month for percentage sold above list price and for average sale price as a percentage of original list, using 2023 through 2025 alone. Its speed advantage narrowed in that period, with April becoming the fastest month on median days to pending.
Is fall a bad time to sell a house in Brighton?
The historical results were weaker in fall than during the February-through-April window, but that does not mean every Brighton homeowner should avoid an autumn sale. Current competing inventory, property condition, pricing, and the seller's timing still matter more than the historical monthly average for any individual house.
Does Brighton Township sell differently than the City of Brighton?
Yes. Brighton Township historically peaked in March. The City of Brighton historically peaked in April. Both areas share a broadly similar late winter through spring window, and City figures are based on fewer annual sales, so read them with slightly more caution than the Township figures.
Does price range affect the best time to sell in Brighton?
At the lower end of the market, yes. Houses under $400,000 sold above list consistently from February through June. Above $600,000, the monthly sample sizes are too small in most months to support a specific seasonal claim, and pricing strategy for those houses should be based on current competing listings rather than a calendar month.
Thinking About Selling a House in Brighton or Brighton Township?
If selling is even a possibility, you do not need a firm moving date to start the conversation. I can review what has recently sold near your house, what is currently competing with it, and what your likely net proceeds would look like under a few different price and timing scenarios.
You can also review my seller net proceeds page or request a home evaluation to get a starting number before we talk.
No pressure. Just clarity.
Jeff Duneske Real Estate
Brighton and Brighton Township Real Estate
Call or text: (248) 939-9393
Email: jeff@duneske.com
Duneske.com
Categories
- All Blogs (190)
- Best Agent For… Blog Series - Northville, Novi, South Lyon & Metro Detroit (41)
- Brighton Real Estate Market Updates (3)
- Buyers (23)
- Community & Local Events (2)
- Divorce Real Estate (11)
- Estate Planning & Strategy (7)
- Golf Course & Luxury Living (6)
- Green Oak Real Estate Market Updates (2)
- Homeowners (Maintenance & Equity) (2)
- Investors (1)
- Market Conditions (12)
- Metro Detroit Real Estate Updates (34)
- Mortgage & Financing (2)
- New Construction (3)
- Northville Real Estate Market Updates (14)
- Novi Real Estate Market Updates (17)
- Pricing & Home Values (7)
- Relocation & Moving (7)
- Rightsizing & Senior Moves (10)
- Seller Success Stories (11)
- Sellers (64)
- South Lyon Real Estate Market Updates (18)
- Tips, Guides & How-To (11)
Recent Posts




GET MORE INFORMATION