

- /
Are More Metro Detroit Home Sellers Reducing Their Price in 2026? What 9,015 Sales Show
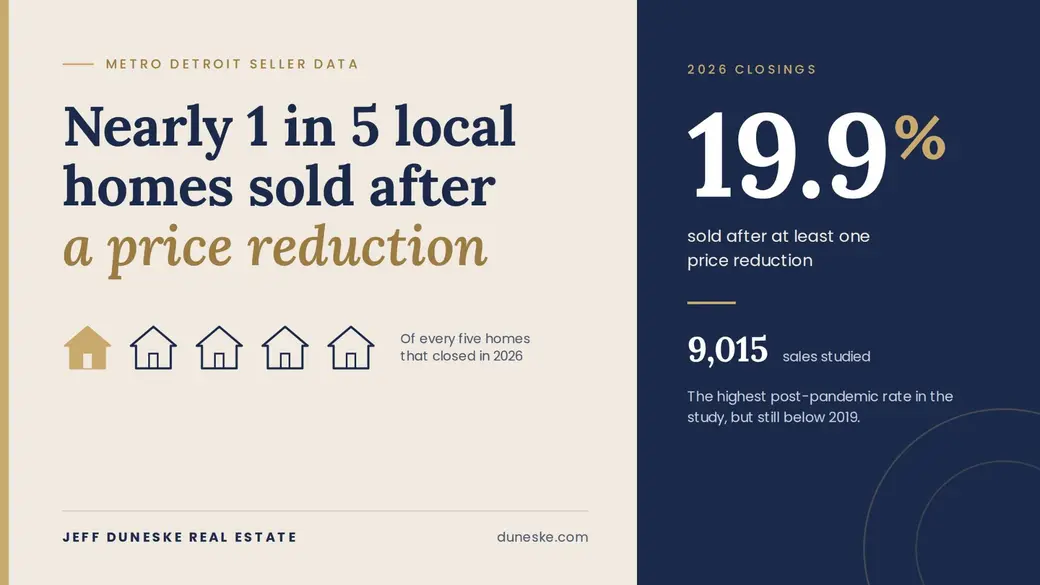
Yes. Price reductions have become more common across the local markets I analyzed.
Among 1,135 residential sales that closed from January 1 through September 21, 2026, 19.9% sold after a net list-price reduction. That was up from 17.1% during the same period in 2025 and was the highest rate among the post-pandemic years studied.
But the longer comparison matters. In 2019, before the pandemic reshaped inventory and buyer competition, 29.9% of local homes sold after a reduction. The 2026 market is moving back toward more normal pricing pressure, but it is not showing the level of reductions seen in 2019.
The practical message for sellers is straightforward. Buyers have more room to be selective than they did during the most competitive years. A well-prepared and accurately positioned home can still sell quickly and sometimes attract multiple offers. A home that begins above what buyers will support has a greater chance of losing momentum and requiring an adjustment.
How often did local homes sell after a price reduction?
I reviewed 9,015 residential closings reported through Realcomp MLS across Northville, Northville Township, Novi, South Lyon, Lyon Township, Green Oak Township, Brighton, and Brighton Township.
The comparison uses closings from January 1 through September 21 of each year. The 2020 market was omitted because pandemic shutdowns and the disruption to normal listing activity make it a poor benchmark.
| Year | Residential closings analyzed | Sales after a net price reduction | Percentage |
|---|---|---|---|
| 2019 | 1,563 | 468 | 29.9% |
| 2021 | 1,645 | 243 | 14.8% |
| 2022 | 1,367 | 181 | 13.2% |
| 2023 | 1,010 | 172 | 17.0% |
| 2024 | 1,124 | 164 | 14.6% |
| 2025 | 1,171 | 200 | 17.1% |
| 2026 | 1,135 | 226 | 19.9% |
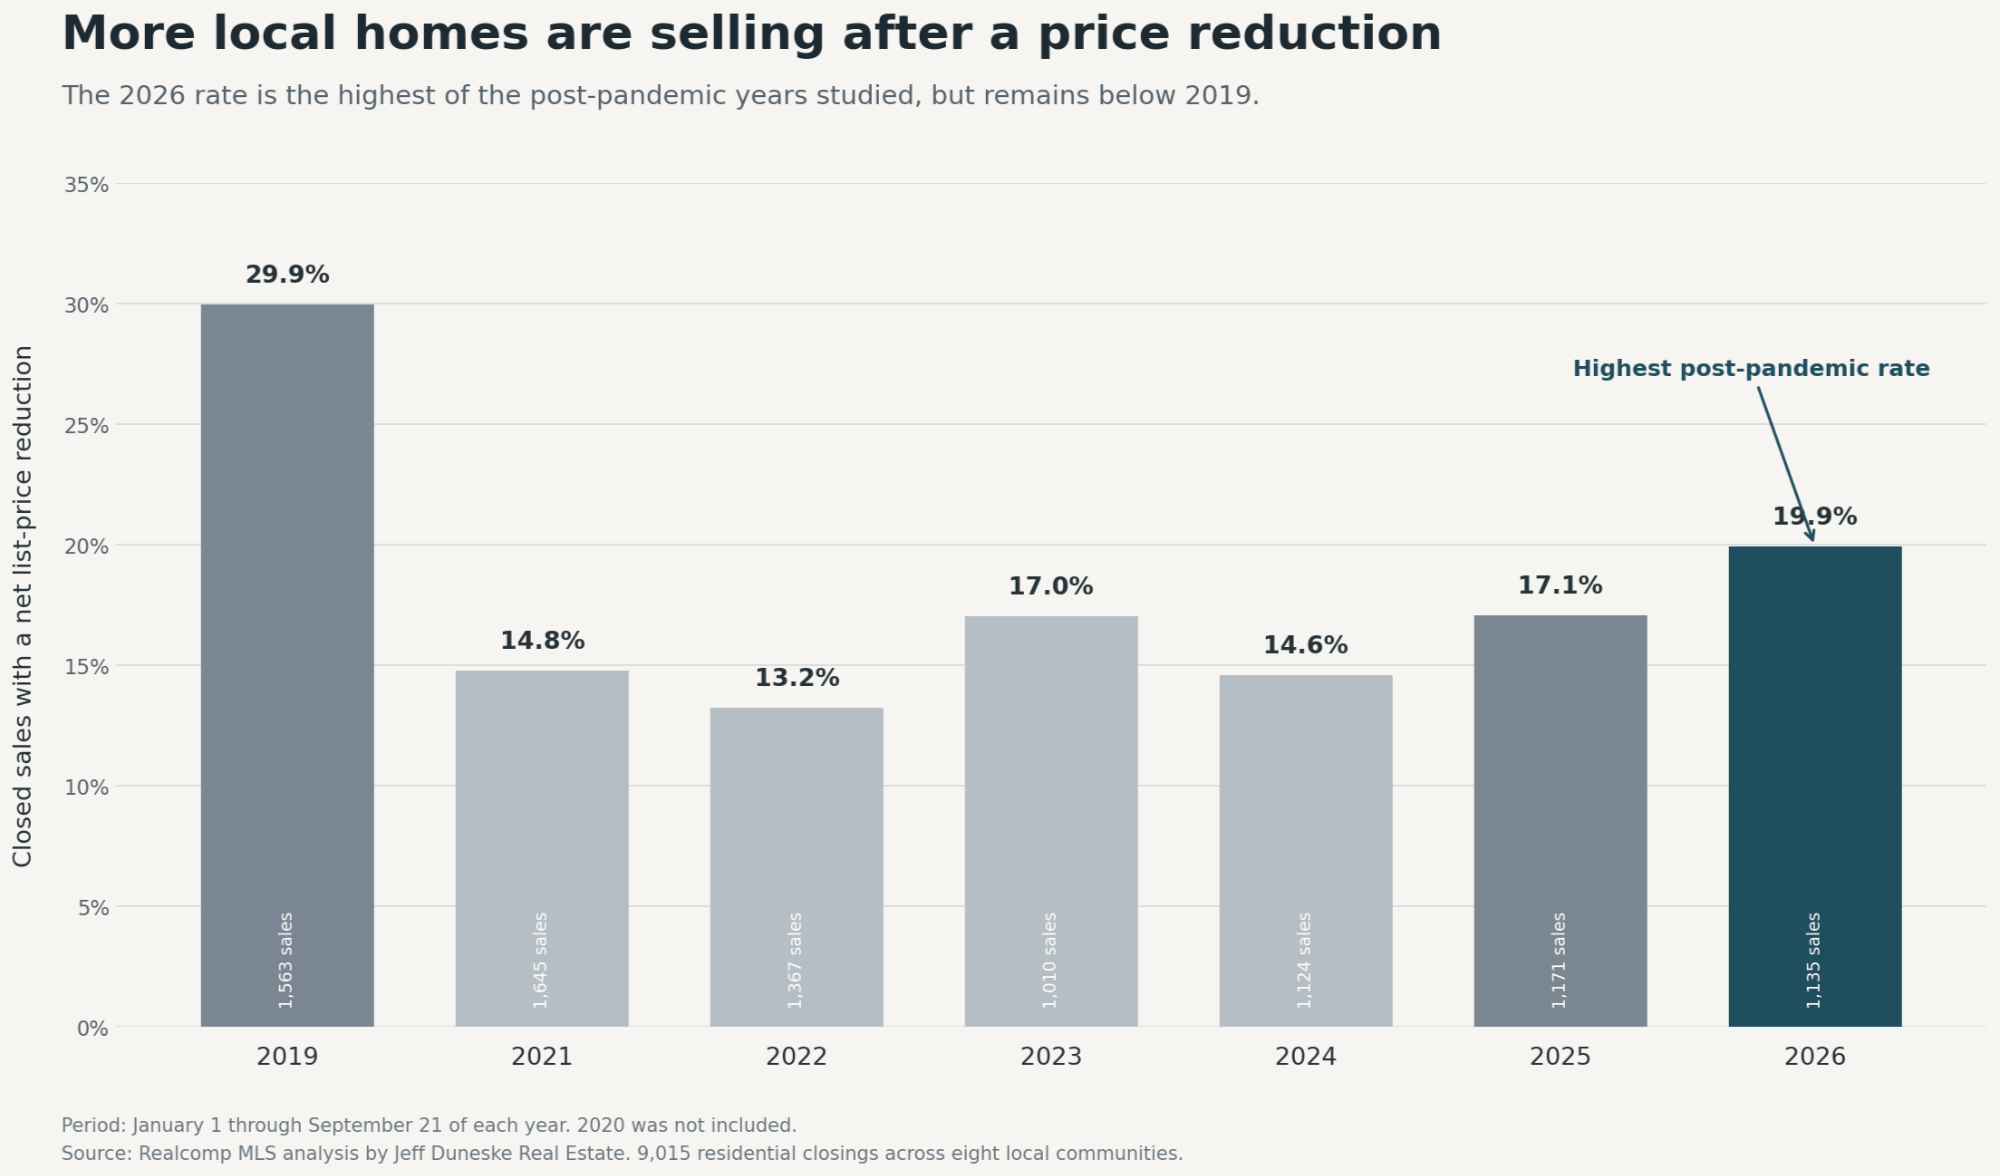
The pattern is not a straight line. The rate rose in 2023, declined in 2024, and then increased during both 2025 and 2026. What stands out is that 2026 produced the highest reduction rate of any post-pandemic year in the study.
That finding is consistent with broader evidence that sellers are making more pricing adjustments. Realtor.com reported that 20.4% of active U.S. listings had a price reduction in August 2026, matching the August 2025 rate. That national measurement is not directly comparable with my analysis because it examines active listings, while my study measures closed local sales whose final list price was below their original list price. (Realtor.com August 2026 Housing Trends)
Does this mean Metro Detroit has become a buyer's market?
Not by itself.
A price-reduction rate tells us how often a listing's first asking price was not the price at which it ultimately competed successfully. It does not measure the complete balance between supply and demand, and it does not mean that every seller who reduced was desperate.
The comparison with 2019 is especially important. Nearly 30% of the homes studied in 2019 sold after a net reduction, compared with just under 20% in 2026. Current conditions are less forgiving than the unusually competitive markets of 2021 and 2022, but reductions are still considerably less common than they were before the pandemic.
I would describe that as normalization. Buyers are evaluating price, condition, updates, setting, and competing inventory more carefully. Sellers still have opportunities, but the market is less likely to overlook an ambitious launch price.
How much were sellers reducing their prices?
Among the 226 local properties that closed after a net reduction in 2026:
- The median reduction was $25,000.
- The median reduction was 4.7% of the original list price.
- The median sale price was 93.0% of the original list price.
- The median sale price was 97.8% of the final list price.
By comparison, homes that did not have a net reduction sold for a median of 100.6% of their original list price.
These numbers do not prove that the original price caused the difference. The reduced group likely includes homes with more difficult condition, location, presentation, or competition. However, the results illustrate an important risk: starting high does not guarantee that a seller will preserve negotiating room.
Sometimes the market responds by not responding. Showings remain limited, buyers choose other homes, and the seller later adjusts the price without recreating the attention that accompanied the original launch.
How did price reductions vary by community in 2026?
The adjustment rate differed substantially across the eight municipalities.
| Community | 2026 closings analyzed | Sales after reduction | Percentage |
|---|---|---|---|
| Brighton | 72 | 24 | 33.3% |
| Northville | 73 | 18 | 24.7% |
| Green Oak Township | 178 | 41 | 23.0% |
| South Lyon | 85 | 19 | 22.4% |
| Lyon Township | 187 | 41 | 21.9% |
| Novi | 272 | 50 | 18.4% |
| Northville Township | 131 | 17 | 13.0% |
| Brighton Township | 137 | 16 | 11.7% |
These figures require context. A city's rate can change based on its mix of price ranges, housing ages, property conditions, and the number of sales. Brighton and Northville had the highest percentages, but each also had fewer than 75 closings in the study period. A relatively small number of transactions can move the annual percentage noticeably.
City and township results should not automatically be combined, either. The housing stock and buyer competition can differ considerably. South Lyon and Lyon Township are a good example. Northville and Northville Township are another.
The community table is useful for identifying a pattern. It is not a substitute for analyzing the homes that directly compete with a specific property.
What did market time look like before a reduced home sold?
Homes that closed without a net price reduction had a median of 6 days on the market in 2026. Homes that closed after a reduction had a median of 44 days on the market.
The difference should not be interpreted as proof that a price reduction causes a home to take longer to sell. The sequence usually runs the other way. A property accumulates market time because buyers have not responded strongly enough, and the seller then changes the price.
The useful lesson is that a reduction generally occurs after the listing has already given up part of its early-market advantage. Buyers who were waiting for new inventory have seen the home. Some may have toured it and chosen another option. Others may begin wondering how motivated the seller has become.
This is why the launch price matters. A later correction can improve the home's position, but it cannot turn the listing back into a brand-new opportunity.
What counts as a price reduction in this analysis?
For this study, a sale counted as reduced when its final MLS list price was lower than its original MLS list price.
That definition is simple and reproducible, but it has limitations:
- It measures a net change between the original and final list prices. It does not reconstruct every temporary price change.
- It does not count a home that sold below asking unless the MLS list price had also been reduced.
- It does not include inspection credits, closing-cost assistance, interest-rate buydowns, or other concessions.
- A canceled and relisted property may receive a new original list price, depending on how the listing was entered.
- The study includes only closed residential sales, not listings that expired, were canceled, or remained active.
For those reasons, the 19.9% figure should be described as the percentage of closed homes that sold after a net MLS list-price reduction. It should not be described as the percentage of all sellers who “had to” reduce.
What should a seller do differently in this market?
The data does not suggest that sellers should automatically price low. It suggests that the opening price needs stronger support.
Compare your home with what buyers can choose now
Closed sales remain important, but active competition affects the decision a buyer is making today. If another home offers a better garage, more finished space, stronger updates, or a better setting at the same price, buyers will notice.
The right comparison is not always the closest sale. It is the home competing for the same buyer. My broader guide to pricing a Metro Detroit home correctly explains how closed sales, current competition, property condition, and buyer demand work together.
Separate estimated value from launch strategy
A probable-value range estimates what buyers may pay. The list price determines how the property enters the market, which searches include it, and which competing homes surround it.
Those numbers are related, but they are not always identical. When the comparable sales are imperfect, the reasoning behind the range matters more than false precision.
Decide how you will evaluate the first response
Before the listing goes live, decide what information will trigger a discussion.
Useful signals include:
- Showing activity compared with similar new listings
- Repeated feedback about price or condition
- Online engagement that does not convert into showings
- Strong traffic without a credible offer
- A new competing listing that changes the buyer's alternatives
The plan should not be “wait a month and see.” It should identify when the evidence will be reviewed and what options the seller will consider.
Do not use a price reduction as the preparation plan
Pricing cannot fully compensate for poor presentation, incomplete repairs, weak photography, or unclear marketing. Buyers evaluate the complete offering.
A home that is prepared and presented well gives the pricing strategy a better chance to work. A home with unresolved problems may still need a lower price, but the reduction should not be the first attempt to solve issues that could have been addressed before launch.
Respond to the market without chasing it
If the evidence shows that the price is not working, a meaningful adjustment is usually more effective than a series of small reductions that keep the home behind the market.
The seller remains in control of whether to change the price, wait, withdraw, or decide not to sell. The agent's responsibility is to explain what the market is saying and the tradeoffs attached to each option.
What is the main takeaway for Metro Detroit homeowners?
Price reductions are becoming more common, but the current market is not simply a return to 2019.
In the eight local markets studied, nearly one in five 2026 closings followed a net list-price reduction. That is more than in any post-pandemic comparison year, yet still substantially below the pre-pandemic rate.
Sellers should not read that as a reason to panic or automatically discount a home. They should read it as a reason to take the launch strategy seriously.
If you are considering selling in Northville, Novi, South Lyon, Lyon Township, Brighton, Green Oak Township, or a nearby community, I can prepare a local pricing and positioning review based on the homes that actually compete with yours.
You will receive a clear explanation of the likely value range, current competition, preparation priorities, and recommended launch strategy. There is no obligation to list.
Call or text me at (248) 939-9393 or email Jeff@Duneske.com.
No pressure. Just clarity.
Data source and methodology
Source: Realcomp MLS data analyzed by Jeff Duneske Real Estate.
The study includes 9,015 residential sales in Northville, Northville Township, Novi, South Lyon, Lyon Township, Green Oak Township, Brighton, and Brighton Township. Each annual comparison covers closings from January 1 through September 21. The 2019 and 2021 through 2026 periods were included. The 2020 period was omitted because pandemic shutdowns and related market disruption made it a poor comparison year. Municipality labels were standardized for capitalization and obvious naming variations. Out-of-area records were excluded.
MLS data is deemed reliable but not guaranteed. Results reflect the records and fields available in the exports and may be affected by listing input practices, relisting, later corrections, or incomplete price-change history.
Categories
- All Blogs (187)
- Best Agent For… Blog Series - Northville, Novi, South Lyon & Metro Detroit (41)
- Brighton Real Estate Market Updates (3)
- Buyers (23)
- Community & Local Events (2)
- Divorce Real Estate (11)
- Estate Planning & Strategy (7)
- Golf Course & Luxury Living (6)
- Green Oak Real Estate Market Updates (2)
- Homeowners (Maintenance & Equity) (2)
- Investors (1)
- Market Conditions (12)
- Metro Detroit Real Estate Updates (33)
- Mortgage & Financing (2)
- New Construction (3)
- Northville Real Estate Market Updates (14)
- Novi Real Estate Market Updates (17)
- Pricing & Home Values (7)
- Relocation & Moving (7)
- Rightsizing & Senior Moves (10)
- Seller Success Stories (11)
- Sellers (62)
- South Lyon Real Estate Market Updates (17)
- Tips, Guides & How-To (11)
Recent Posts



GET MORE INFORMATION