

- /
Metro Detroit Housing Market Update: August 2026
There is no single Metro Detroit housing market. The August 2026 numbers make that clear. Median sale prices, inventory and selling times varied widely from one community to the next, and in some cases between a city and the township around it.
For homeowners and buyers, the takeaway is simple. The market surrounding a specific home matters more than any Metro Detroit headline. Price range, neighborhood, condition, property type and current competition can produce very different results within the same community.
Across Livingston, Macomb, Oakland and Wayne counties, the August residential median sale price was $320,000, up 4.2% from August 2025. There were 3,632 residential closings. Homes averaged 27 days on market, sellers received 99.1% of list price on average, and inventory stood at 3.1 months. The year-to-date median was $300,000.
Here is how the local markets I follow closely compared.
August Median Sale Prices by Community
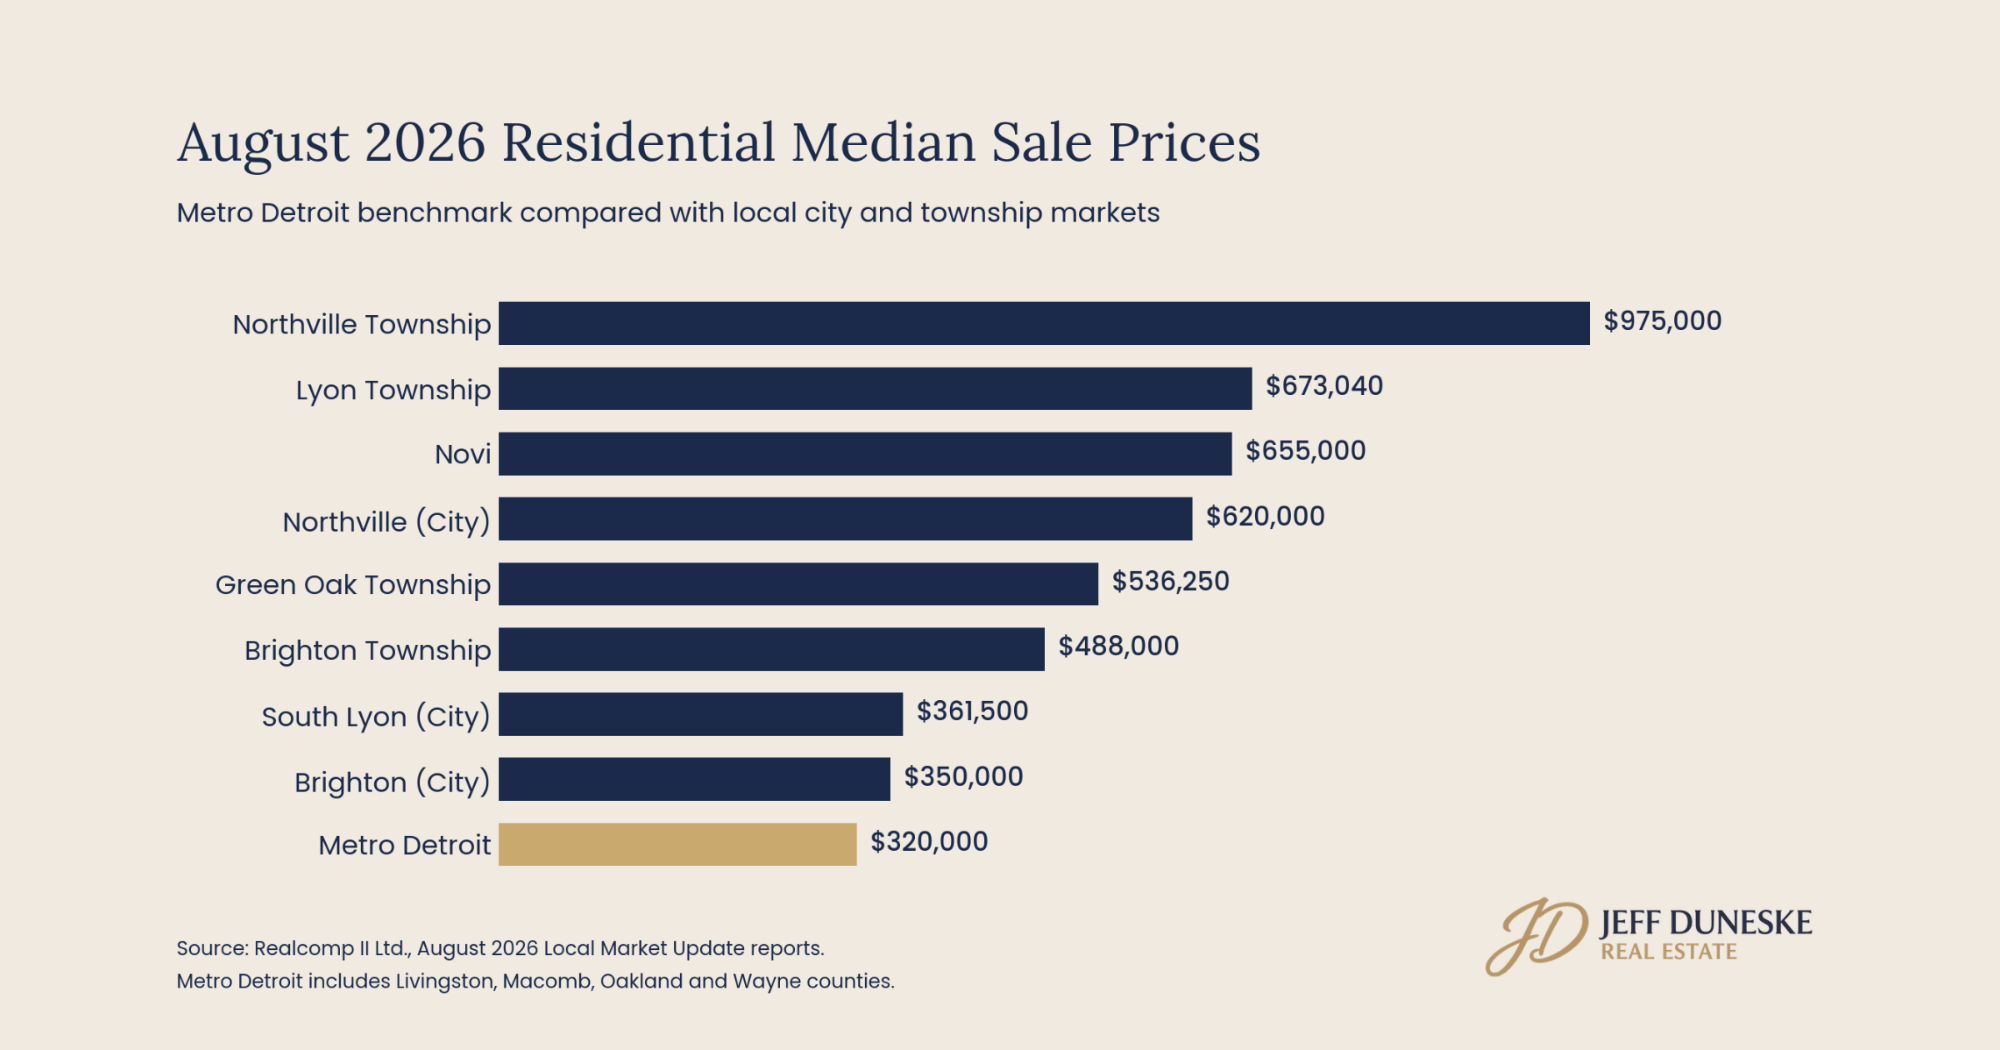
The August residential median sale price was $975,000 in Northville Township, $673,040 in Lyon Township, $655,000 in Novi, $620,000 in Northville (City), $536,250 in Green Oak Township, $488,000 in Brighton Township, $361,500 in South Lyon (City) and $350,000 in Brighton (City). Every one of these markets was above the Metro Detroit median of $320,000.
Some of the largest percentage changes below come from markets with very few closings. A handful of sales can move a monthly median dramatically. That is why I would never treat one month's median as the change in value of an individual home.
Northville: The City and Township Moved in Different Directions
Northville (City) had an August median sale price of $620,000, compared with $853,750 in August 2025. That is a 27.4% decline. It is also based on only seven closings, compared with 28 the prior August.
Homes in Northville (City) averaged 21 days on market, sellers received 100.3% of list price, and inventory stood at 2.8 months. The year-to-date median was $630,000, which gives a steadier view than a single month of seven sales.
Northville Township had 19 closings and a median of $975,000, up 3.4% from August 2025. Homes averaged 14 days on market, sellers received 100.9% of list price, and inventory stood at 3.4 months. The year-to-date median was $830,000.
I would be very careful with any headline suggesting Northville home values fell 27.4%. The mix of homes that happened to close in one month can move the median considerably, especially when so few homes sold.
For more Northville statistics and analysis, see the Northville real estate market report.
Novi: A Strong Month and a More Moderate Year
Novi's August median sale price was $655,000, up 11.8% from $586,000 in August 2025. There were 45 residential closings. Homes averaged 19 days on market, sellers received 100.2% of list price, and inventory remained limited at 2.1 months.
The year-to-date view is more moderate. Through August, Novi's median was $599,000, up 3.3% from $580,000 during the same period of 2025.
Neither number is wrong. They measure different periods. That is why I look at several indicators before drawing any conclusion about a specific Novi home. Novi's housing stock also varies widely by neighborhood, age, updates and price range, which can create very different competitive situations within the same city.
For the complete picture, see the Novi real estate market report.
South Lyon and Lyon Township: Inventory Is the Story
South Lyon (City) recorded eight residential closings in August with a median sale price of $361,500, down 33.1% from $540,000 in August 2025. The prior August had 22 closings. With so few sales this year, that decline likely says more about which eight homes happened to close than about the value of any particular South Lyon home.
Homes in South Lyon (City) averaged 16 days on market, sellers received 100.5% of list price, and inventory stood at 2.0 months. The year-to-date median was $450,000.
Lyon Township looked considerably different. There were 33 closings with a median of $673,040, up 2.9% from August 2025. Homes averaged 29 days on market, the longest of the local markets in this report, and sellers received 99.7% of list price. The year-to-date median was $650,000.
Inventory is the number I would watch most closely in Lyon Township. There were 74 residential homes for sale in August 2026, compared with 32 in August 2025, an increase of 131.3%. Months of inventory rose from 1.5 to 3.7.
With significantly more homes on the market than a year ago, Lyon Township buyers have more alternatives, which makes pricing, condition and presentation more important.
For more detail, see the South Lyon and Lyon Township real estate market report.
Brighton: One Name, Two Very Different Inventory Levels
Only four residential homes closed in Brighton (City) during August. The median sale price was $350,000, down 10.7% from August 2025. Homes averaged 10 days on market and sellers received 101.3% of list price, although four sales is a very small sample.
Inventory in Brighton (City) was extremely limited. Only nine homes were for sale, compared with 43 in August 2025, representing just 0.7 months of inventory. The year-to-date median was $400,500.
Brighton Township moved in the opposite direction. There were 21 closings with a median of $488,000, up 6.7% from August 2025. Homes averaged 13 days on market and sellers received 98.2% of list price. The number of homes for sale rose from 28 to 52, and inventory stood at 3.5 months. The year-to-date median was $495,000.
A homeowner who hears that Brighton has less than one month of inventory could draw the wrong conclusion if the home is actually in Brighton Township. Same name. Very different competition.
For the full breakdown, see the Brighton real estate market report.
Green Oak Township: More Sales Without a Higher Median
Green Oak Township had 34 residential closings in August 2026, compared with 17 in August 2025. Homes averaged 23 days on market, down from 30 a year earlier. Sellers received 100.2% of list price, and inventory was unchanged at 2.2 months.
The August median sale price was $536,250, down 3.4% from $555,000. Through August, the year-to-date median was $470,000, down 8.4% from $513,000 during the same period of 2025.
That does not mean Green Oak homes lost 8.4% of their value. It means the homes that sold this year had a lower median than the homes that sold during the same period in 2025. In a township with such a wide range of neighborhoods, acreage, lake-area properties and newer construction, the mix of sales matters.
For more on Green Oak, see the Green Oak Township real estate market report.
What August Means If You Are Thinking About Selling
I would not use the same pricing strategy in every community. A seller in Brighton (City) is competing against a handful of listings. A seller in Lyon Township is entering a market with significantly more inventory than a year ago. Those are very different conversations about price, preparation and timing.
For an individual home, the useful analysis goes well beyond a citywide median. I want to know what has recently sold nearby, what is competing with the home right now, how buyers are responding in that price range, and how the property compares in condition, location and features. The goal is to position the home where buyers recognize value and have a reason to act.
What August Means If You Are Buying
Among the markets with 19 or more August closings, the average percent of list price received ranged from 98.2% in Brighton Township to 100.9% in Northville Township.
Those are averages, not offer instructions. A fresh, well-presented home drawing strong early interest calls for a different strategy than one that has been available for several weeks in an area where inventory is growing. More inventory does not make every home easier to negotiate.
The Bottom Line
Market statistics describe what is happening around a property. They do not tell you what that property is worth. That takes a closer look at the neighborhood, recent comparable sales, current competition, condition, updates and the buyers most likely to consider the home.
Wondering What This Means for Your Home?
I have worked in Metro Detroit real estate since 2000. If you are considering a move, I am happy to look past the headline numbers with you, walk through the market around your particular home, and help you understand your options, whether you sell now, later, or not at all.
Prefer to talk it through first? Send me your question.
No pressure. Just clarity.
Source: Realcomp II Ltd., Local Market Update reports for August 2026, current as of September 8, 2026. Metro Detroit figures include Livingston, Macomb, Oakland and Wayne counties. Percent of list price received does not account for sale concessions or down payment assistance. Percentage changes can appear extreme in markets with small numbers of sales, and monthly statistics should not be interpreted as the change in value of an individual property.
Categories
- All Blogs (189)
- Best Agent For… Blog Series - Northville, Novi, South Lyon & Metro Detroit (41)
- Brighton Real Estate Market Updates (3)
- Buyers (23)
- Community & Local Events (2)
- Divorce Real Estate (11)
- Estate Planning & Strategy (7)
- Golf Course & Luxury Living (6)
- Green Oak Real Estate Market Updates (2)
- Homeowners (Maintenance & Equity) (2)
- Investors (1)
- Market Conditions (12)
- Metro Detroit Real Estate Updates (34)
- Mortgage & Financing (2)
- New Construction (3)
- Northville Real Estate Market Updates (14)
- Novi Real Estate Market Updates (17)
- Pricing & Home Values (7)
- Relocation & Moving (7)
- Rightsizing & Senior Moves (10)
- Seller Success Stories (11)
- Sellers (63)
- South Lyon Real Estate Market Updates (17)
- Tips, Guides & How-To (11)
Recent Posts


GET MORE INFORMATION