

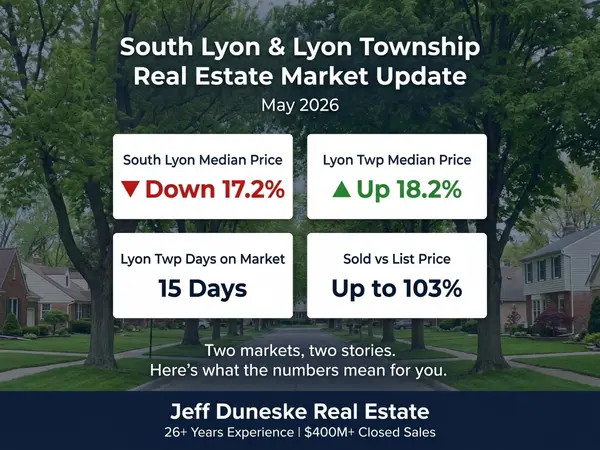
South Lyon and Lyon Township: Two Markets, One ZIP Code Mindset
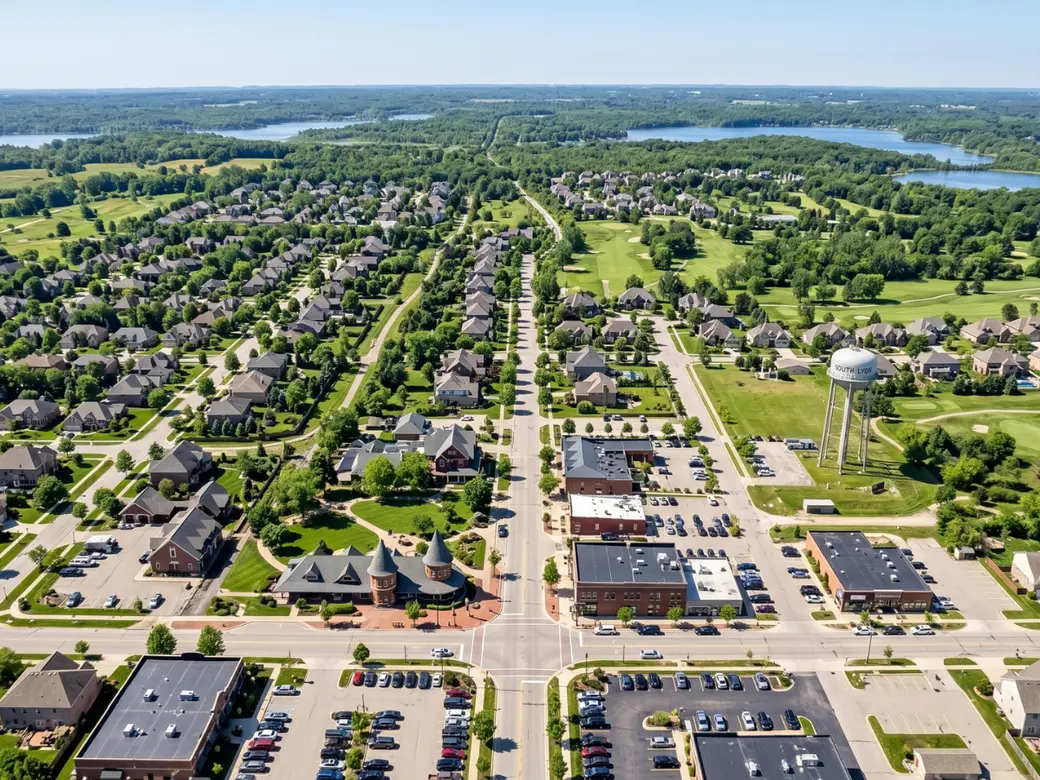
If you live in South Lyon or Lyon Township, or you are shopping there, you probably treat them as one market. They share schools, they share a ZIP code in most people's minds, and they share buyers who are looking at homes on both sides of the city line without knowing exactly where the line is. That is a reasonable way to live in this part of the county. It is not a great way to read the April 2026 numbers, because those numbers are telling two clearly different stories this spring.
This update breaks down both markets honestly, including a few places where small sample sizes are making the data look more dramatic than it really is. The goal is to give you a clear read on what each market is doing, so you can plan around it instead of guessing.
South Lyon city: tight, steady, and still moving
Quick Answer: South Lyon city's residential market had 14 new listings in April 2026, with 10 closed sales, days on market improving from 37 to 28, and months of supply at 1.3 — tighter than a year earlier. The April median sale price was $545,000, down from $618,001 in April 2025, but the year-to-date median is up 5.7 percent. Sellers received 99.6 percent of list price on average.
South Lyon city residential is the more stable of the two markets right now. Inventory rose modestly from 15 to 17 homes, but months of supply actually fell from 1.7 to 1.3, which means demand more than absorbed the small bump in listings. Days on market improved year over year, which is a sign that buyers are still acting on homes they like.
The April median price drop is the number that catches people's eye, but it should not be read on its own. The year-to-date median is up 5.7 percent and closed sales are up 41.7 percent through April. That tells me April's lower median is more about the mix of homes that sold this month than it is about a real shift in direction.
South Lyon City Residential — April 2026 vs April 2025
| Metric | April 2025 | April 2026 | Change |
|---|---|---|---|
| New Listings | 17 | 14 | −17.6% |
| Closed Sales | 10 | 10 | 0.0% |
| Median Sale Price | $618,001 | $545,000 | −11.8% |
| Days on Market | 37 | 28 | −24.3% |
| List-to-Sale | 98.6% | 99.6% | +1.0% |
| Months of Supply | 1.7 | 1.3 | −23.5% |
South Lyon city condos: significantly more inventory, more buyer leverage
The South Lyon condo market is telling a different story than the residential side, and it is worth understanding clearly. New condo listings rose 60 percent year over year, inventory more than doubled from 19 to 48 units, and months of supply jumped from 2.3 to 5.0. That is a real shift toward a buyer-friendlier market.
At the same time, closed condo sales actually rose 125 percent in April, and the median condo sale price rose 23.4 percent year over year. So buyers are still buying. They just have more choices, which means they are also in a stronger position to negotiate price and terms than they were a year ago.
What this means in South Lyon city
For residential sellers:
- Low supply still supports leverage, particularly if your home is priced and presented well
- Do not assume the April median drop signals a softening market — the YTD numbers tell the real story
- Days on market improving means buyers are still moving quickly on the right homes
For residential buyers:
- Expect competition. Most homes are still receiving close to list price
- Be prepared with financing and a clear sense of priorities before you start looking
For condo buyers and sellers:
- Condo buyers have meaningfully more leverage than they did in 2024 or 2025
- Condo sellers should plan for a longer marketing window and price with current competition in mind
Lyon Township: softer April, but the trend is steadier than it looks
Quick Answer: Lyon Township's residential market saw closed sales fall 63.2 percent year over year in April 2026, with 7 closed sales versus 19 the prior April. Days on market rose from 33 to 43. The April median sale price was $605,000, down 12.3 percent year over year, but the year-to-date median is essentially flat at $575,000 (+0.9 percent). Sellers received 101.3 percent of list price on average — actually higher than a year ago.
Lyon Township's April numbers look harder than they really are on the surface. Closed sales dropped sharply, days on market lengthened, and the April median price fell more than 12 percent. Read in isolation, that sounds like a market in trouble.
But the year-to-date numbers tell a different story. The YTD median sale price is up 0.9 percent compared to last year, and the year-to-date list-to-sale ratio is unchanged at 99.8 percent. The April list-to-sale ratio actually rose to 101.3 percent, which means the homes that did sell in April received more than full list price on average. That is not the signature of a soft market. That is the signature of a market with low transaction volume and a more selective group of buyers.
Months of supply rose from 2.4 to 2.8, which moves Lyon Township into more balanced territory than South Lyon city. Inventory itself barely changed — 49 homes versus 50 a year earlier — but the slower pace of pending and closed sales pushed the supply-to-demand ratio higher.
Lyon Township Residential — April 2026 vs April 2025
| Metric | April 2025 | April 2026 | Change |
|---|---|---|---|
| New Listings | 39 | 35 | −10.3% |
| Closed Sales | 19 | 7 | −63.2% |
| Median Sale Price | $690,000 | $605,000 | −12.3% |
| Days on Market | 33 | 43 | +30.3% |
| List-to-Sale | 99.9% | 101.3% | +1.4% |
| Months of Supply | 2.4 | 2.8 | +16.7% |
Lyon Township condos: read these numbers carefully
The Lyon Township condo numbers in April are dramatic on paper, but they need to be read with honest context. Only one condo closed in April 2026 in Lyon Township. That single transaction is what is driving the headline numbers — a median sale price up 106.7 percent and days on market up 1,520 percent.
A note on the Lyon Township condo data. When a market has one or two transactions in a given month, every percentage change becomes a story about that specific sale rather than the market as a whole. The more useful number here is months of supply, which jumped from 2.6 to 9.6. That is a real signal: Lyon Township condo buyers have significantly more inventory and negotiating room than they had a year ago. The price and days-on-market changes are not.
The takeaway is that Lyon Township condos have moved into a clear buyer's market. Whether that benefits you depends entirely on which side of the transaction you are on.
What this means in Lyon Township
For residential sellers:
- The April headline numbers look harder than the market actually is
- Sellers who priced well still received above list price on average
- Expect a longer marketing window than in South Lyon city — average days on market is now 43
- Year-to-date prices are essentially flat, not falling
For residential buyers:
- More breathing room than in South Lyon city — 2.8 months of supply gives you time to think
- Strong homes still receive multiple offers. Average list-to-sale of 101.3 percent says so
- This is a better market for measured buyers than for buyers who need a discount on the right home
For condo buyers and sellers:
- Buyers have meaningful leverage. Months of supply at 9.6 is a clear buyer's market
- Sellers should plan for a longer marketing window and price with current competition in mind
- Be careful drawing conclusions from any single comparable sale right now
South Lyon city versus Lyon Township at a glance
The clearest way to see how different these two markets are this spring is to put them side by side. Notice especially the difference in months of supply, days on market, and the pace of closed sales.
April 2026 Residential Snapshot — South Lyon City vs Lyon Township
| Metric | South Lyon City | Lyon Township |
|---|---|---|
| Closed Sales (April) | 10 | 7 |
| Closed Sales YoY | 0.0% | −63.2% |
| Median Sale Price (April) | $545,000 | $605,000 |
| YTD Median Change | +5.7% | +0.9% |
| Days on Market | 28 | 43 |
| List-to-Sale (April) | 99.6% | 101.3% |
| Months of Supply | 1.3 | 2.8 |
South Lyon city is tighter on supply and selling faster. Lyon Township has more inventory, longer marketing times, and lower transaction volume in April, but homes that sold actually received slightly more than list price on average. Different markets, different strategies, different conversations.
Jeff's Take
The thing I want people in this area to understand is that South Lyon and Lyon Township are not interchangeable when it comes to pricing strategy and timing. A home a mile apart on either side of the city line is in a different competitive environment right now.
The right starting point is not the headline data. It is your specific home, your specific price range, and where your particular competition actually sits. The numbers in this update are useful for setting expectations. They are not a substitute for looking at your situation directly.
If you are weighing a move in either market
If you are thinking about buying or selling in South Lyon city or Lyon Township this spring, the best next step is to look at your move through the lens of your specific neighborhood and property type. The April numbers give us useful context, but the local details are what help people make confident decisions.
I am happy to walk through your specific situation, with no pressure to do anything other than make sure you have the right information.
About the Author
Jeff Duneske is an Associate Broker based in Northville, Michigan, with more than 26 years of experience and over 1,300 closed transactions across South Lyon, Lyon Township, Novi, Northville, Plymouth, Brighton, and the surrounding Metro Detroit communities. A former firefighter and EMT, Jeff built his business around honest communication, hyperlocal market knowledge, and a relationship-first approach. Roughly 75 percent of his business comes from past client referrals.
Categories
- All Blogs (245)
- Best Agent For… Blog Series - Northville, Novi, South Lyon & Metro Detroit (88)
- Buyers (37)
- Community & Local Events (2)
- Divorce Real Estate (12)
- Estate Planning & Strategy (11)
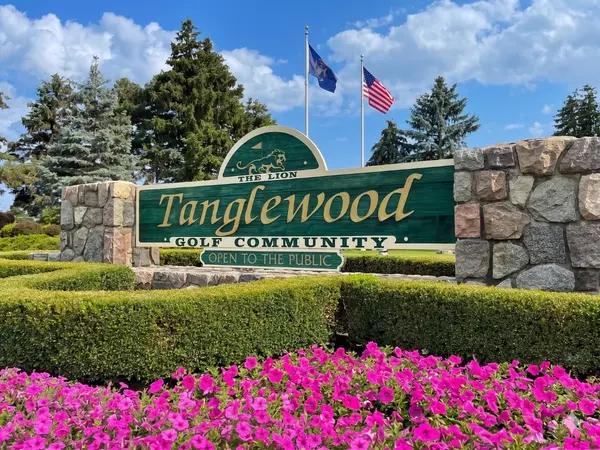
- Golf Course & Luxury Living (6)
- Homeowners (Maintenance & Equity) (3)
- Investors (4)
- Market Conditions (12)
- Market Updates (Metro Detroit / Local) (65)
- Mortgage & Financing (2)
- New Construction (5)
- Northville Real Estate Market Updates (10)
- Novi Real Estate Market Updates (8)
- Pricing & Home Values (7)
- Relocation & Moving (10)
- Rightsizing & Senior Moves (18)
- Sellers (81)
- South Lyon Real Estate Market Updates (10)
- Tips, Guides & How-To (13)
Recent Posts


GET MORE INFORMATION