

- /
When Is the Best Time to Sell a Home in Northville, Michigan? What 1,079 Local Sales Show.
If you are thinking about selling a home in Northville, one of the first questions you will probably ask is simple.
When is the best time to put my home on the market?
The usual answer is spring.
I wanted to know whether Northville's own sales history supports that, so I analyzed 1,079 residential sales across the City of Northville and Northville Township.
Instead of relying on national statistics or broad Metro Detroit averages, I looked at when Northville homes came on the market, how quickly they went pending, and whether they sold above their original asking prices.
The pattern is real. It is also a milder pattern than what I found in some neighboring markets, and that turns out to be one of the more useful things this analysis tells a Northville homeowner.
How I Analyzed the Northville Sales Data
I treated the City of Northville and Northville Township together because that is how most buyers and sellers think about this market. Someone searching for a Northville home is generally not filtering by municipal boundary.
For the month-by-month comparison, I used listings that came to market during the four complete calendar years of 2022 through 2025, which gives 1,079 traditional residential sales. Using complete calendar years matters because including partial years would give some months more years of data than others and distort the comparison before it started.
I also excluded two manufactured home sales, which are not representative of the Northville housing market.
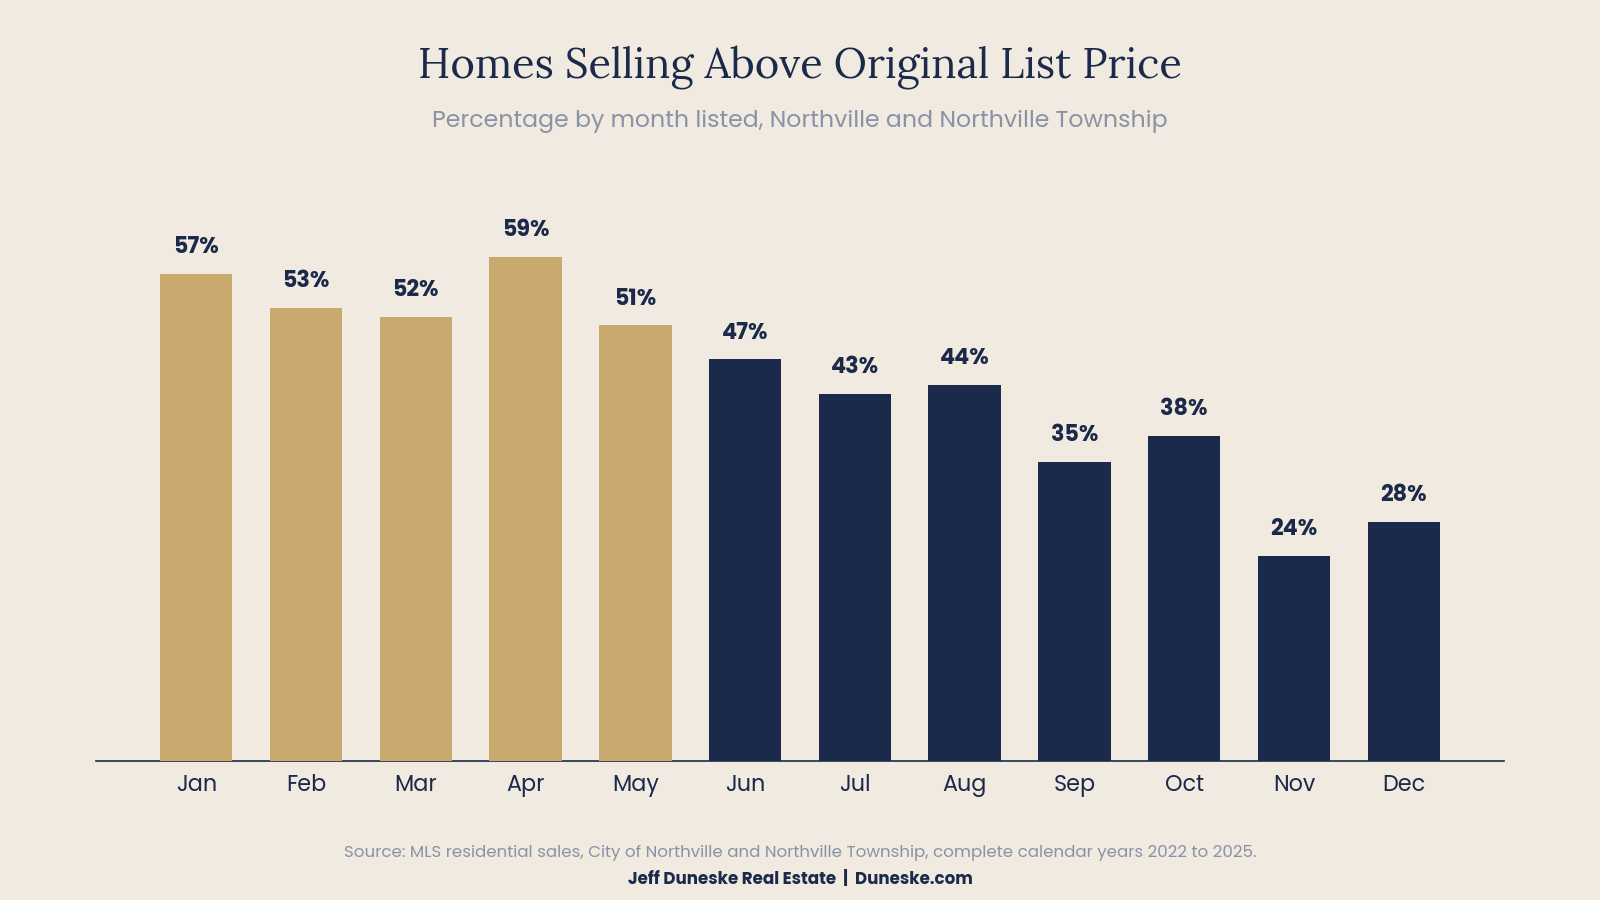
I focused on two measures. The first is the median number of days from listing to pending. The second is the percentage of homes that sold above their original asking price. Together, they tell us far more about buyer competition than comparing monthly median sale prices.
Median Days to Pending by Month Listed
Northville Home Selling Trends by Month
| Month Listed | Median Days to Pending | Sold Above Original List Price |
|---|---|---|
| January | 6.5 | 57% |
| February | 8 | 53% |
| March | 8 | 52% |
| April | 7 | 59% |
| May | 8 | 51% |
| June | 8 | 47% |
| July | 13 | 43% |
| August | 12 | 44% |
| September | 20 | 35% |
| October | 13 | 38% |
| November | 20 | 24% |
| December | 13 | 28% |
Figures reflect residential sales in the City of Northville and Northville Township for listings that came to market during the four complete calendar years of 2022 through 2025.
Two cautions are worth noting. January carries far fewer listings than the spring months, so its figures can move more easily based on a smaller number of transactions. The fall months also do not decline in a clean line, so I view September through December as a generally weaker seasonal stretch rather than trying to rank those months precisely against one another.
What the Northville Data Shows
The strongest stretch runs from late winter through spring.
April produced the best overall combination in the data. Homes listed in April reached pending status in a median of seven days, approximately 59 percent sold above their original asking price, and the average sale landed at roughly 102.66 percent of the original list price.
That is the strongest above-list result of any month in the analysis.
But I would be careful about leaning too heavily on April alone.
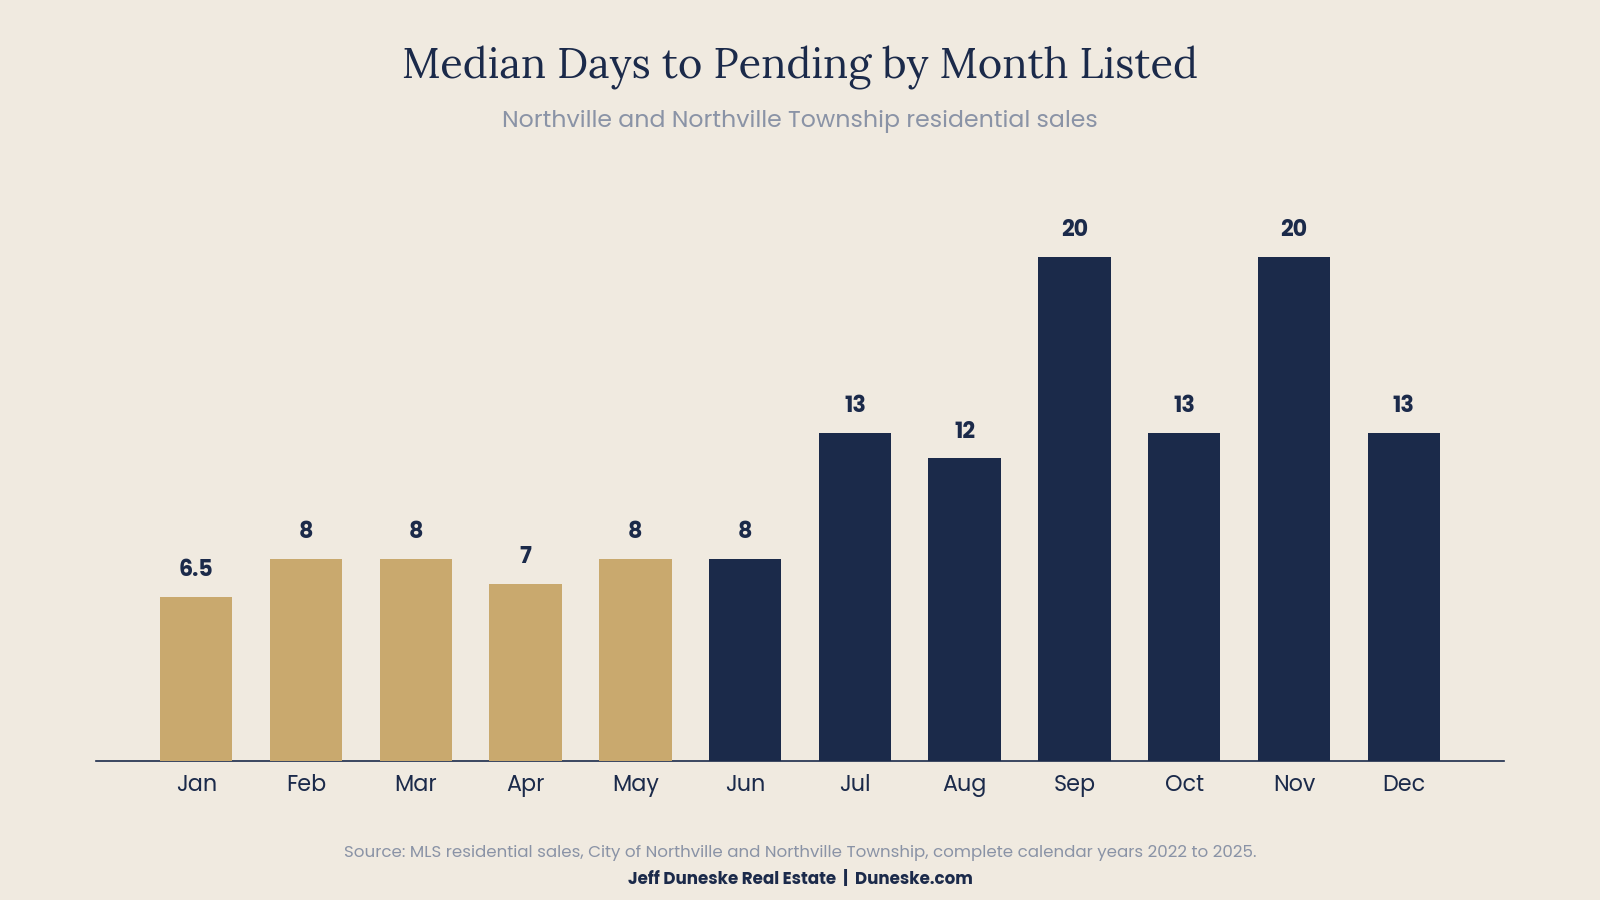
Homes Selling Above Original List Price by Month
The Northville Seasonal Signal Is Real, but It Is Not Dramatic
This is the part I think matters most for a Northville homeowner, and it is the part many seasonal real estate articles would skip.
Look at the percentage of homes selling above original list price from January through May. The figures run 57, 53, 52, 59, and 51 percent.
April leads, but it leads by only a handful of percentage points over the months sitting right next to it. Median days to pending across those same five months run between 6.5 and 8 days, which is essentially the same market response.
In other words, Northville does not have one clearly superior month. It has a broad early-year window where the market behaves consistently well, with April modestly leading a closely grouped set.
I found a sharper seasonal pattern when I analyzed South Lyon and Lyon Township home sales, where March separated itself more clearly from the surrounding months.
The practical takeaway for a Northville seller is encouraging. If your home is ready in February and you have a good reason to sell, the data does not suggest you are giving up much by not waiting until April.
The difference between those two months is likely smaller than the difference thoughtful pricing, preparation, and presentation can make.
What Happens After Spring?
The change later in the year is much more pronounced than the differences within the spring window.
June held at approximately eight days to pending. July moved to approximately 13 days, and August to approximately 12 days. From September onward, the median ranged from 13 to 20 days depending on the month.
The percentage of homes selling above original list price followed a similar pattern. April reached approximately 59 percent. By July and August, the figure was in the low to middle forties. From September through December, it ranged from approximately 24 to 38 percent.
That is a meaningful shift, and it is a much larger difference than anything inside the January through May window.
Is Fall a Bad Time to Sell a Home in Northville?
No.
Monthly statistics describe what happened across roughly a thousand homes. They do not describe what will happen with one specific property.
There are fewer buyers searching in October or November, but there are usually fewer competing homes available to them as well. Buyers still actively looking that late in the year often have a reason. They may be relocating. Their current home may have sold. A lease may be ending. Their family situation may have changed.
What changes in the fall is how much the details matter. Pricing, preparation, photography, condition, and the first week on market all carry more weight when the buyer pool is smaller.
A Northville home with little direct competition can be in an excellent position even when the seasonal averages look weaker.
The City and the Township Do Not Always Behave the Same Way
This is worth knowing if you own a home in Northville.
Even within a single community, seasonality is not identical. In the City of Northville, the February through May stretch was consistently quick, with median time to pending running around six days.
In Northville Township, April was the standout, with roughly two thirds of April listings selling above their original asking price.
I would treat those figures as directional rather than precise. Splitting a four-year dataset by municipality and then again by month leaves a smaller number of sales in each group, and small samples can move easily.
But the underlying point holds regardless of the exact numbers. The City and Township have different housing stock, different ages of construction, different lot sizes, different price ranges, and different buyer pools.
A historic home near downtown Northville is not competing for exactly the same buyer as a newer colonial on a larger Township lot. It would be a mistake to assume a community-wide average describes both equally well.
You can explore more about the different neighborhoods and homes across the community on my Northville real estate page.
Does the Best Time to Sell Change by Price Range in Northville?
Somewhat. Northville has a wide enough price range for this to matter more here than in many nearby communities.
Homes priced from roughly $500,000 to $749,000 performed strongly across a long stretch, from February through July.
Homes from roughly $750,000 to $999,000 were most competitive in March and April.
Homes above $1 million showed more variability throughout the year and generally took longer, particularly outside the spring months.
I am deliberately not giving month-by-month figures for every price band. Once you divide four years of sales into several price tiers and then divide those again into twelve months, the number of sales behind an individual figure can become small enough to imply more precision than the data supports.
The directional finding is still useful. As the price point rises, the outcome depends increasingly on presentation, pricing accuracy, the number of qualified buyers, and the specific competition a home faces.
The Highest Median Sale Price Does Not Identify the Best Month
It is tempting to compare monthly median sale prices and conclude that the month with the highest figure must be the best month to sell.
That can be misleading, especially in Northville.
The mix of homes changes every month. One month may include several historic district properties or higher priced estates. Another may include more condominiums or smaller homes. That can move the median sale price even when underlying market conditions have not changed significantly.
Your home would not automatically sell for more simply because it was listed during a month with a higher community-wide median sale price.
That is why I place more weight on how quickly buyers responded and whether homes sold above or below their original asking prices. Those measures tell us more about buyer competition than which particular homes happened to close during a given month.
So When Should You List Your Northville Home?
Based on this analysis, the answer has two parts.
Late winter through spring has historically been Northville's strongest window, with April producing the best overall combination of speed and above-list-price sales.
At the same time, the differences within that early-year window are small enough that readiness should usually outrank the calendar.
Your neighborhood may have three competing homes coming soon, or none. Your home may be ready today, while another property could gain significantly from a month of preparation.
Interest rates, inventory, price range, condition, competing listings, buyer demand, and your own moving plans all factor into the decision.
The best listing date is not necessarily the strongest month historically. It is the point when your home is prepared, the competition is favorable, and the buyers most likely to want your property are actively looking.
Thinking About Selling a Home in Northville?
If selling is even a possibility, you do not need to know your exact moving date before starting the conversation.
I can look at what has recently sold around your home, what is currently competing with it, buyer activity in your price range, and what may be coming to market.
You can also learn more about my approach to pricing, preparation, and marketing on my Sell My Northville Home page.
From there, we can decide whether getting ahead of the spring market, targeting the stronger early-year window, selling later with less competition, or simply taking more time to prepare makes the most sense for you.
No pressure. Just clarity.
Jeff Duneske Real Estate
Northville Real Estate
Call or text: (248) 939-9393
Duneske.com
Local Market Insight
This analysis uses MLS residential sales data for the City of Northville and Northville Township, based on the 1,079 listings that entered the market during the four complete calendar years of 2022 through 2025. Two manufactured home sales were excluded as unrepresentative of the local market.
Historical patterns can help inform a selling strategy, but they cannot predict the result of an individual sale. Neighborhood, condition, price range, property type, inventory, competing listings, financing conditions, and buyer demand all influence the outcome.
Real estate decisions are local, and in a community with as much variety as Northville, small differences between homes and neighborhoods can matter significantly.
If you would like to talk through how this applies to your home, I am always happy to help.
Categories
- All Blogs (190)
- Best Agent For… Blog Series - Northville, Novi, South Lyon & Metro Detroit (41)
- Brighton Real Estate Market Updates (3)
- Buyers (23)
- Community & Local Events (2)
- Divorce Real Estate (11)
- Estate Planning & Strategy (7)
- Golf Course & Luxury Living (6)
- Green Oak Real Estate Market Updates (2)
- Homeowners (Maintenance & Equity) (2)
- Investors (1)
- Market Conditions (12)
- Metro Detroit Real Estate Updates (34)
- Mortgage & Financing (2)
- New Construction (3)
- Northville Real Estate Market Updates (14)
- Novi Real Estate Market Updates (17)
- Pricing & Home Values (7)
- Relocation & Moving (7)
- Rightsizing & Senior Moves (10)
- Seller Success Stories (11)
- Sellers (64)
- South Lyon Real Estate Market Updates (18)
- Tips, Guides & How-To (11)
Recent Posts



GET MORE INFORMATION